
Search for cities, countries, lakes and rivers
Tilichiki
Water Temperature in the Bering Sea in Tilichiki, Russia: Current, Historical Data and Forecast
On this page, you will find comprehensive information about the sea temperature in Tilichiki in Russia, including current readings, historical data and trends, monthly averages, as well as weather forecasts and upcoming temperature predictions. We find every spot where you can swim and tell you what the water temperature is there today and throughout the year.
Current Water Temperature in Tilichiki
4.4°C
TODAY
4.8°C
YESTERDAY
5.7°C
A WEEK AGO
Analysis, Historical Data, and Forecast of Water Temperature
Today sea water temperature in the Bering Sea in Tilichiki is 4.4°C. Such water is extremely cold and not recommended for swimming without proper preparation. In these conditions, the risk of hypothermia is very high, and prolonged exposure to the water can be hazardous to your health. If you decide to swim, it is important to have the appropriate gear, such as a wetsuit. Typically, only experienced swimmers or those who practice winter swimming venture into such waters.
It is important to note that these swimming tips and recommendations apply only in good weather. When the air temperature is below 68°F (20°C), and sometimes even below 77°F (25°C), swimming can be unpleasant even with relatively high water temperatures.
Water Temperature Chart for Bering Sea in Tilichiki Over the Last 30 Days
The water temperature in Tilichiki today is lower than both a week ago and a month ago. Today's sea temperature is generally in line with historical values for this day.
According to our forecast, the sea temperature in Tilichiki will remain nearly unchanged in the coming days, its value will be 4.2°C.
Actual nearshore water temperatures may fluctuate by several degrees from the reported values, especially following heavy rainfall or extended periods of strong winds. Certain wind patterns can cause colder, deeper waters to rise and replace the sun-warmed surface water, leading to noticeable variations.
Our forecast is based on a proprietary mathematical model that considers real-time water temperature changes, historical trends, key weather patterns, wind strength and direction, and air temperature specific to each region. Additionally, we incorporate data from other resorts across Russia to enhance accuracy.
Water temperature data for Tilichiki and nearby towns and resorts is gathered from various sources, including buoys and satellite sea and ocean surface maps provided by the NOAA agency. We also incorporate data from local authorities in each specific location worldwide to ensure more accurate temperature readings.
Table of Daily Sea Temperature Data
| Date | Current | Average | Forecast |
|---|---|---|---|
| Oct 20 | 5.7°C | 5.8°C | |
| Oct 21 | 5.5°C | 5.8°C | |
| Oct 22 | 5.2°C | 5.5°C | |
| Oct 23 | 5.0°C | 5.0°C | |
| Oct 24 | 5.0°C | 4.8°C | |
| Oct 25 | 4.9°C | 4.5°C | |
| Oct 26 | 4.8°C | 4.5°C | |
| Oct 27 | 4.6°C | 4.5°C | |
| Oct 28 | 4.5°C | 4.4°C | |
| Oct 29 | 4.8°C | 4.4°C | |
| Oct 30 | 4.5°C | 4.4°C | |
| Oct 31 | 4.0°C | 4.3°C | |
| Nov 1 | 4.3°C | 4.3°C | |
| Nov 2 | 4.5°C | 4.3°C | |
| Nov 3 | 4.0°C | 4.3°C | |
| Nov 4 | 3.8°C | 4.2°C |
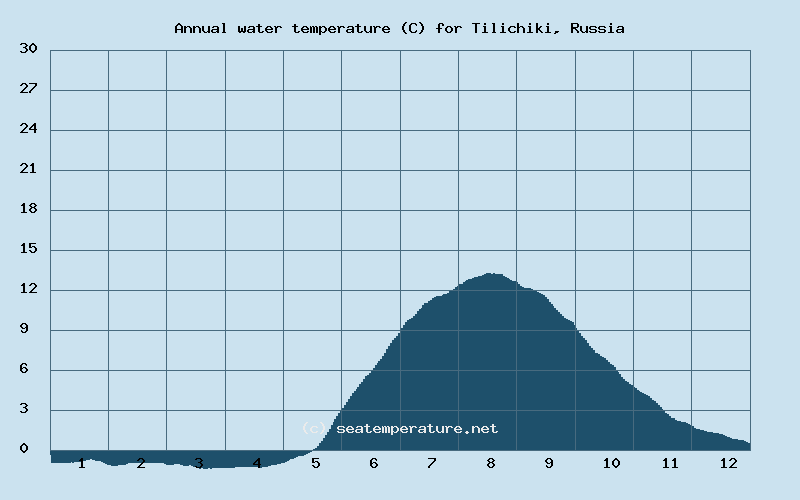
Sea Temperature in Tilichiki Throughout the Year
Throughout the year, the sea temperature in Tilichiki never exceeds 64°F (18°C).
Below is the annual chart of sea temperature changes in the Bering Sea in Tilichiki.
January
| Minimum | Average | Maximum |
|---|---|---|
| -3°C | -1°C | 1°C |
February
| Minimum | Average | Maximum |
|---|---|---|
| -2°C | -0.5°C | 1°C |
March
| Minimum | Average | Maximum |
|---|---|---|
| -2°C | -0.5°C | 1°C |
April
| Minimum | Average | Maximum |
|---|---|---|
| -2°C | -0.5°C | 1°C |
May
| Minimum | Average | Maximum |
|---|---|---|
| -2°C | 1.5°C | 5°C |
June
| Minimum | Average | Maximum |
|---|---|---|
| 0°C | 5.5°C | 11°C |
July
| Minimum | Average | Maximum |
|---|---|---|
| 8°C | 11.5°C | 15°C |
August
| Minimum | Average | Maximum |
|---|---|---|
| 9°C | 12°C | 15°C |
September
| Minimum | Average | Maximum |
|---|---|---|
| 6°C | 10°C | 14°C |
October
| Minimum | Average | Maximum |
|---|---|---|
| 2°C | 5.5°C | 9°C |
November
| Minimum | Average | Maximum |
|---|---|---|
| 0°C | 3°C | 6°C |
December
| Minimum | Average | Maximum |
|---|---|---|
| -2°C | 0.5°C | 3°C |
Monthly Water Temperature Histogram for Bering Sea in Tilichiki
You can explore detailed data on how the water temperature in Tilichiki varies each month:
Tilichiki Weather
OCTOBER 28
-12°C / -7°C
clear skyhumidity: 63% | wind: 3 km/h
OCTOBER 29
-12°C / -6°C
clear skyhumidity: 71% | wind: 1 km/h
OCTOBER 30
-10°C / -5°C
broken clouds: 51-84%humidity: 90% | wind: 3 km/h
OCTOBER 31
-9°C / -5°C
overcast clouds: 85-100%humidity: 93% | wind: 1 km/h


Sea Temperature in the Bering Sea in Tilichiki: General Trends and Swimming Opportunities
The climate in the coastal area of the Kamchatka Krai region in Russia is subarctic maritime, characterized by cold, wet weather, and substantial rainfall throughout the year. It features cool summers with temperatures averaging between 10°C to 14°C, and long, cold winters with temperatures often falling below freezing.
Geographical Location of Tilichiki
Frequently Asked Questions About Tilichiki and its Water Temperatures
What is the current sea temperature in Tilichiki?
The water temperature today in the Bering Sea in Tilichiki is 40°F (4.4°C).
What sea temperatures can I expect in Tilichiki in the next month?
In November, the water temperature in the Bering Sea in Tilichiki will range between 32°F (0°C) and 43°F (6°C)