
Search for cities, countries, lakes and rivers
Nizhnevartovsk
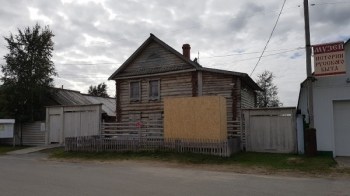
© Karl-Heinz Kronacher
Water Temperature in Nizhnevartovsk in Ob River: Current and Forecast
On this page, you will find comprehensive information about the water temperature in Nizhnevartovsk in Ob River, including current readings, historical data and trends, monthly averages, as well as weather forecasts and upcoming temperature predictions. We find every spot where you can swim and tell you what the water temperature is there today and throughout the year.
Current Water Temperature in Nizhnevartovsk
2.1°C
TODAY
2.1°C
YESTERDAY
2.6°C
A WEEK AGO
As of today, the minimum water temperature in Nizhnevartovsk ranges less than 41°F (5°C). Such water is extremely cold and not recommended for swimming without proper preparation. In these conditions, the risk of hypothermia is very high, and prolonged exposure to the water can be hazardous to your health. If you decide to swim, it is important to have the appropriate gear, such as a wetsuit. Typically, only experienced swimmers or those who practice winter swimming venture into such waters.
It is important to note that these swimming tips and recommendations apply only in good weather. When the air temperature is below 68°F (20°C), and sometimes even below 77°F (25°C), swimming can be unpleasant even with relatively high water temperatures.
Analysis, Historical Data, and Forecast of Water Temperature
Water Temperature Chart for Ob River in Nizhnevartovsk Over the Last 30 Days
Today the water temperature in Nizhnevartovsk is higher than the same day in previous years. The water temperature range here in November is from 0°C to 4°C. The water temperature is trending downward, and it has decreased both over the past 30 days and the past week.
The forecasted water temperature values for Nizhnevartovsk are presented in the table below.
The actual water temperature values near the shore may differ by a few degrees from the stated values. For the development of the forecast, we use our own mathematical model that takes into account the current water temperature changes, historical data, and key weather trends, including wind strength and direction, and air temperature in each specific region.
Table of Daily Water Temperature Data
| Date | Current | Average | Forecast |
|---|---|---|---|
| Nov 10 | 2.6°C | 2.0°C | |
| Nov 11 | 2.6°C | 2.0°C | |
| Nov 12 | 2.6°C | 2.0°C | |
| Nov 13 | 2.6°C | 2.0°C | |
| Nov 14 | 2.5°C | 2.0°C | |
| Nov 15 | 2.4°C | 2.0°C | |
| Nov 16 | 2.1°C | 2.0°C | |
| Nov 17 | 2.1°C | 2.0°C | |
| Nov 18 | 2.0°C | 2.1°C | |
| Nov 19 | 2.0°C | 2.1°C | |
| Nov 20 | 2.0°C | 2.1°C | |
| Nov 21 | 2.0°C | 2.1°C | |
| Nov 22 | 2.0°C | 2.1°C | |
| Nov 23 | 2.0°C | 2.1°C | |
| Nov 24 | 2.0°C | 2.1°C | |
| Nov 25 | 2.0°C | 2.1°C |
Water Temperature Ranges in Nizhnevartovsk by Month
January
| Minimum | Average | Maximum |
|---|---|---|
| 2°C | 3°C | 4°C |
February
| Minimum | Average | Maximum |
|---|---|---|
| 2°C | 3°C | 4°C |
March
| Minimum | Average | Maximum |
|---|---|---|
| 2°C | 3°C | 4°C |
April
| Minimum | Average | Maximum |
|---|---|---|
| 1°C | 4.5°C | 8°C |
May
| Minimum | Average | Maximum |
|---|---|---|
| 3°C | 10°C | 17°C |
June
| Minimum | Average | Maximum |
|---|---|---|
| 5°C | 14°C | 23°C |
July
| Minimum | Average | Maximum |
|---|---|---|
| 13°C | 17.5°C | 22°C |
August
| Minimum | Average | Maximum |
|---|---|---|
| 11°C | 16.5°C | 22°C |
September
| Minimum | Average | Maximum |
|---|---|---|
| 3°C | 9°C | 15°C |
October
| Minimum | Average | Maximum |
|---|---|---|
| 2°C | 6.5°C | 11°C |
November
| Minimum | Average | Maximum |
|---|---|---|
| 0°C | 2°C | 4°C |
December
| Minimum | Average | Maximum |
|---|---|---|
| 0°C | 2°C | 4°C |
Monthly Water Temperature Histogram for Ob River in Nizhnevartovsk
Water Temperature in Nizhnevartovsk: General Trends and Swimming Opportunities
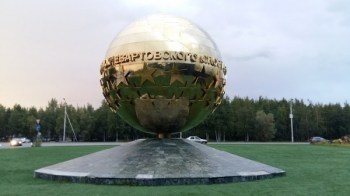
© Динара Саитгареева
Geographical Location of Nizhnevartovsk
Frequently Asked Questions About Nizhnevartovsk and its Water Temperatures
What is the current water temperature in Nizhnevartovsk?
The water temperature today in Nizhnevartovsk is 36°F (2.1°C).
Is it possible to swim in the Ob River in Nizhnevartovsk, and what are the available options for doing so?
Yes, it is possible to swim in the Ob River in Nizhnevartovsk. Options include public beaches, organized swimming sites, or boating trips that allow a safe swim.