
Search for cities, countries, lakes and rivers
Chupa

Water Temperature in the White Sea in Chupa, Russia: Current, Historical Data and Forecast
On this page, you will find comprehensive information about the sea temperature in Chupa in Russia, including current readings, historical data and trends, monthly averages, as well as weather forecasts and upcoming temperature predictions. We find every spot where you can swim and tell you what the water temperature is there today and throughout the year.
Current Water Temperature in Chupa
5.4°C
TODAY
5.1°C
YESTERDAY
5.9°C
A WEEK AGO
Analysis, Historical Data, and Forecast of Water Temperature
Today sea water temperature in the White Sea in Chupa is 5.4°C. This water temperature is still quite low, and swimming in such conditions may only be comfortable for hardened individuals. It is recommended to limit the time spent in the water to avoid hypothermia. For those not accustomed to cold water, it is better to refrain from swimming. However, if you decide to enter the water, it is advisable to wear a warm wetsuit for protection against the cold.
It is important to note that these swimming tips and recommendations apply only in good weather. When the air temperature is below 68°F (20°C), and sometimes even below 77°F (25°C), swimming can be unpleasant even with relatively high water temperatures.
Water Temperature Chart for White Sea in Chupa Over the Last 30 Days
The water temperature in Chupa today is lower than both a week ago and a month ago. Today's sea temperature is generally in line with historical values for this day.
According to our forecast, the sea temperature in Chupa will remain nearly unchanged in the coming days, its value will be 4.5°C.
Actual nearshore water temperatures may fluctuate by several degrees from the reported values, especially following heavy rainfall or extended periods of strong winds. Certain wind patterns can cause colder, deeper waters to rise and replace the sun-warmed surface water, leading to noticeable variations.
Our forecast is based on a proprietary mathematical model that considers real-time water temperature changes, historical trends, key weather patterns, wind strength and direction, and air temperature specific to each region. Additionally, we incorporate data from other resorts across Russia to enhance accuracy.
Water temperature data for Chupa and nearby towns and resorts is gathered from various sources, including buoys and satellite sea and ocean surface maps provided by the NOAA agency. We also incorporate data from local authorities in each specific location worldwide to ensure more accurate temperature readings.
Table of Daily Sea Temperature Data
| Date | Current | Average | Forecast |
|---|---|---|---|
| Oct 21 | 5.9°C | 6.0°C | |
| Oct 22 | 5.7°C | 5.5°C | |
| Oct 23 | 5.6°C | 5.3°C | |
| Oct 24 | 5.5°C | 5.3°C | |
| Oct 25 | 5.2°C | 5.0°C | |
| Oct 26 | 5.2°C | 5.0°C | |
| Oct 27 | 5.1°C | 4.8°C | |
| Oct 28 | 5.4°C | 4.5°C | |
| Oct 29 | 4.5°C | 5.3°C | |
| Oct 30 | 4.3°C | 5.1°C | |
| Oct 31 | 4.0°C | 4.9°C | |
| Nov 1 | 4.3°C | 4.8°C | |
| Nov 2 | 4.3°C | 4.7°C | |
| Nov 3 | 4.3°C | 4.6°C | |
| Nov 4 | 4.3°C | 4.6°C | |
| Nov 5 | 4.0°C | 4.5°C |
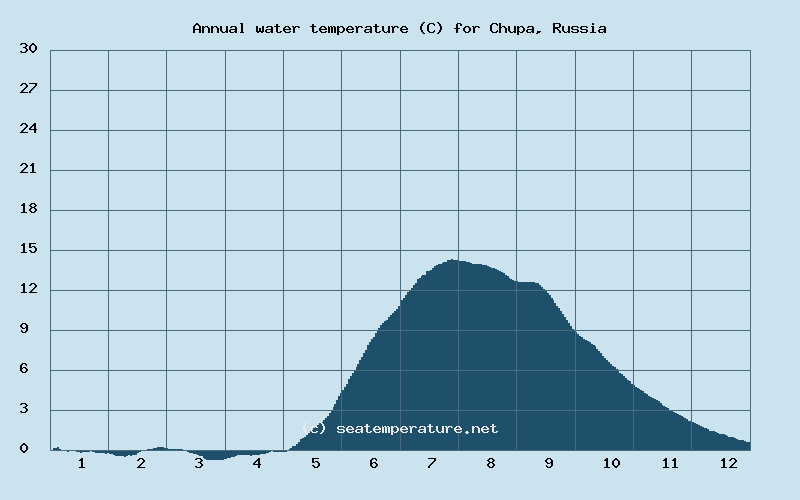
Sea Temperature in Chupa Throughout the Year
Throughout the year, the sea temperature in Chupa never exceeds 64°F (18°C).
Below is the annual chart of sea temperature changes in the White Sea in Chupa.
January
| Minimum | Average | Maximum |
|---|---|---|
| -2°C | 0°C | 2°C |
February
| Minimum | Average | Maximum |
|---|---|---|
| -2°C | 0°C | 2°C |
March
| Minimum | Average | Maximum |
|---|---|---|
| -2°C | 0.5°C | 3°C |
April
| Minimum | Average | Maximum |
|---|---|---|
| -2°C | 0°C | 2°C |
May
| Minimum | Average | Maximum |
|---|---|---|
| -1°C | 3.5°C | 8°C |
June
| Minimum | Average | Maximum |
|---|---|---|
| 3°C | 8.5°C | 14°C |
July
| Minimum | Average | Maximum |
|---|---|---|
| 10°C | 13.5°C | 17°C |
August
| Minimum | Average | Maximum |
|---|---|---|
| 10°C | 13°C | 16°C |
September
| Minimum | Average | Maximum |
|---|---|---|
| 5°C | 9.5°C | 14°C |
October
| Minimum | Average | Maximum |
|---|---|---|
| 1°C | 5.5°C | 10°C |
November
| Minimum | Average | Maximum |
|---|---|---|
| 0°C | 3°C | 6°C |
December
| Minimum | Average | Maximum |
|---|---|---|
| -1°C | 1°C | 3°C |
Monthly Water Temperature Histogram for White Sea in Chupa
You can explore detailed data on how the water temperature in Chupa varies each month:
What Beaches Are There In and Around Chupa?
Lesnoy Park Medvezhka
Lesnoy Park Medvezhka is a 1-stars sandy beach, is located directly in Chupa.
Chupa Weather
OCTOBER 29
4°C / 5°C
overcast clouds: 85-100%humidity: 91% | wind: 2 km/h
OCTOBER 30
2°C / 4°C
overcast clouds: 85-100%humidity: 83% | wind: 4 km/h
OCTOBER 31
1°C / 2°C
overcast clouds: 85-100%humidity: 85% | wind: 4 km/h
NOVEMBER 1
2°C / 3°C
light rainhumidity: 97% | wind: 4 km/h


Sea Temperature in the White Sea in Chupa: General Trends and Swimming Opportunities
The coastal area of the Republic of Karelia, Russia, experiences a subarctic climate, characterized by cold, lengthy winters and brief, mild summers. Its proximity to the Baltic sea and large bodies of water like Lake Onega and Lake Ladoga moderate the temperature, causing more precipitation and humidity compared to inner regions.
Chupa is located in Europe in the Northern Hemisphere at a latitude of 66 degrees, along the shores of the White Sea. Chupa lies within the Republic of Karelia in Russia.
The average annual daytime air temperature in Chupa is 8°C (46°F), with the average nighttime temperature being -0°C (32°F). The highest average daily temperature occurs in July, reaching 22°C (72°F), while the lowest is in February at -4°C (25°F). As for nighttime temperatures, the minimum average temperature of -12°C (11°F) is recorded in January, and the maximum is in July, reaching 13°C (55°F).
According to historical data, Chupa experiences 124 rainy days per year, which accounts for 34 percent of all days in the year. On average, there are 10 rainy days each month. The wettest month is December, with 12 rainy days and 45 mm (1.8 inches) of precipitation, while the driest month is April, which typically has 8 rainy days and only 32 mm (1.3 inches) of precipitation.
The average annual water temperature in White Sea in Chupa is 5°C (41°F). In January, the water reaches its lowest point of the year at -2°C (28°F), while in July, it peaks at 17°C (63°F). In Chupa, the water temperature in the White Sea never consistently reaches a comfortable level for swimming in any month.
Geographical Location of Chupa
Frequently Asked Questions About Chupa and its Water Temperatures
What is the current sea temperature in Chupa?
The water temperature today in the White Sea in Chupa is 42°F (5.4°C).
In which months is the water temperature in Chupa comfortable for swimming?
It cannot be guaranteed that the water temperature in Chupa will be comfortable for swimming in any month of the year.
What is the water temperature in Chupa during the winter?
The water temperature in the White Sea in Chupa during the winter ranges from -2°C to 3°C (28°F to 37°F).
What is the water temperature in Chupa during the spring?
The water temperature in the White Sea in Chupa during the spring ranges from -2°C to 8°C (28°F to 46°F).
What is the water temperature in Chupa during the summer?
The water temperature in the White Sea in Chupa during the summer ranges from 3°C to 17°C (37°F to 63°F).
What is the water temperature in Chupa during the fall?
The water temperature in the White Sea in Chupa during the fall ranges from 0°C to 14°C (32°F to 57°F).
Is it possible to swim in the sea in Chupa at any time of the year?
In Chupa, the White Sea is quite cold, and swimming is almost impossible as the water temperature never reaches 21°C (70°F).
What sea temperatures can I expect in Chupa in the next month?
In November, the water temperature in the White Sea in Chupa will range between 32°F (0°C) and 43°F (6°C)