
Search for cities, countries, lakes and rivers
Moa

Water Temperature in the Caribbean Sea in Moa, Cuba: Current, Historical Data and Forecast
On this page, you will find comprehensive information about the sea temperature in Moa in Cuba, including current readings, historical data and trends, monthly averages, as well as weather forecasts and upcoming temperature predictions. We find every spot where you can swim and tell you what the water temperature is there today and throughout the year.
Current Water Temperature in Moa
29.0°C
TODAY
29.6°C
YESTERDAY
30.4°C
A WEEK AGO
Analysis, Historical Data, and Forecast of Water Temperature
Today sea water temperature in the Caribbean Sea in Moa is 29°C. This is very warm water, which may feel almost hot to most people. Swimming in such conditions is perfect for those seeking relaxation and comfort in the water. These waters are often preferred for relaxation in hot weather, as the water temperature does not cool the body significantly. However, it is important to remember that in such warm waters, caution is necessary, as prolonged exposure without rest can lead to overheating.
It is important to note that these swimming tips and recommendations apply only in good weather. When the air temperature is below 68°F (20°C), and sometimes even below 77°F (25°C), swimming can be unpleasant even with relatively high water temperatures.
Water Temperature Chart for Caribbean Sea in Moa Over the Last 30 Days
The water temperature in Moa today is lower than both a week ago and a month ago. Today's sea temperature is generally in line with historical values for this day.
According to our forecast, the sea temperature in Moa will remain nearly unchanged in the coming days, its value will be 28.9°C.
Actual nearshore water temperatures may fluctuate by several degrees from the reported values, especially following heavy rainfall or extended periods of strong winds. Certain wind patterns can cause colder, deeper waters to rise and replace the sun-warmed surface water, leading to noticeable variations.
Our forecast is based on a proprietary mathematical model that considers real-time water temperature changes, historical trends, key weather patterns, wind strength and direction, and air temperature specific to each region. Additionally, we incorporate data from other resorts across Cuba to enhance accuracy.
Water temperature data for Moa and nearby towns and resorts is gathered from various sources, including buoys and satellite sea and ocean surface maps provided by the NOAA agency. We also incorporate data from local authorities in each specific location worldwide to ensure more accurate temperature readings.
Table of Daily Sea Temperature Data
| Date | Current | Average | Forecast |
|---|---|---|---|
| Oct 23 | 30.4°C | 29.3°C | |
| Oct 24 | 29.3°C | 29.3°C | |
| Oct 25 | 29.6°C | 29.3°C | |
| Oct 26 | 29.3°C | 28.8°C | |
| Oct 27 | 29.4°C | 29.0°C | |
| Oct 28 | 29.6°C | 29.3°C | |
| Oct 29 | 29.6°C | 29.0°C | |
| Oct 30 | 29.0°C | 29.3°C | |
| Oct 31 | 29.0°C | 29.0°C | |
| Nov 1 | 29.3°C | 29.0°C | |
| Nov 2 | 29.5°C | 29.1°C | |
| Nov 3 | 29.3°C | 29.1°C | |
| Nov 4 | 29.3°C | 29.1°C | |
| Nov 5 | 28.8°C | 29.1°C | |
| Nov 6 | 28.5°C | 29.0°C | |
| Nov 7 | 28.5°C | 28.9°C |
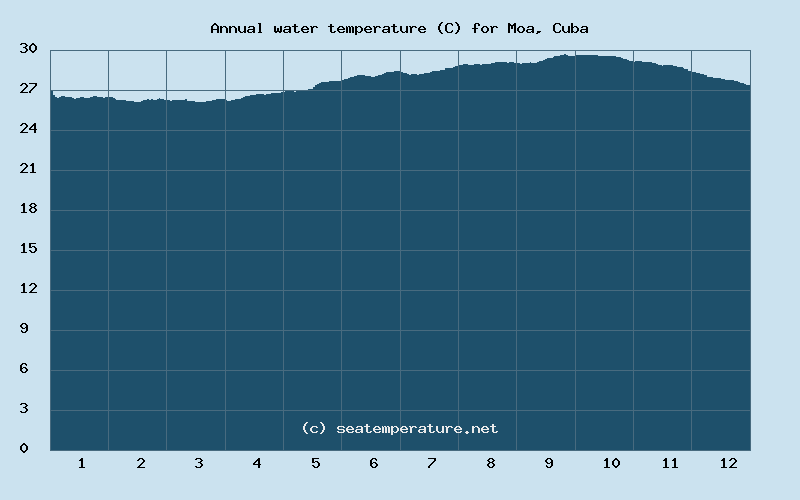
Sea Temperature in Moa Throughout the Year
Throughout the year, the sea temperature in Moa is always above 64°F (18°C), the sea temperature exceeds 72°F (22°C) for 366 days, and exceeds 77°F (25°C) for 366 days.
Below is the annual chart of sea temperature changes in the Caribbean Sea in Moa.
January
| Minimum | Average | Maximum |
|---|---|---|
| 24°C | 25.5°C | 27°C |
February
| Minimum | Average | Maximum |
|---|---|---|
| 24°C | 26°C | 28°C |
March
| Minimum | Average | Maximum |
|---|---|---|
| 25°C | 26.5°C | 28°C |
April
| Minimum | Average | Maximum |
|---|---|---|
| 25°C | 26.5°C | 28°C |
May
| Minimum | Average | Maximum |
|---|---|---|
| 25°C | 27°C | 29°C |
June
| Minimum | Average | Maximum |
|---|---|---|
| 26°C | 28°C | 30°C |
July
| Minimum | Average | Maximum |
|---|---|---|
| 27°C | 28.5°C | 30°C |
August
| Minimum | Average | Maximum |
|---|---|---|
| 27°C | 29°C | 31°C |
September
| Minimum | Average | Maximum |
|---|---|---|
| 27°C | 29°C | 31°C |
October
| Minimum | Average | Maximum |
|---|---|---|
| 28°C | 29.5°C | 31°C |
November
| Minimum | Average | Maximum |
|---|---|---|
| 26°C | 28°C | 30°C |
December
| Minimum | Average | Maximum |
|---|---|---|
| 26°C | 27.5°C | 29°C |
Monthly Water Temperature Histogram for Caribbean Sea in Moa
You can explore detailed data on how the water temperature in Moa varies each month:
What Beaches Are There In and Around Moa?
Playa De Cayo Moa Grande
Playa De Cayo Moa Grande is a 3-stars sandy beach, located in a 6 km (4 miles) radius of Moa. Playa De Cayo Moa Grande is an excellent spot for fishing enthusiasts, offering good opportunities to catch local fish. Snorkeling is possible. The calm waters make this beach ideal for swimming, providing a safe and enjoyable experience for all visitors.
Moa Weather
OCTOBER 31
25°C / 29°C
light rainhumidity: 85% | wind: 1 km/h
NOVEMBER 1
26°C / 31°C
overcast clouds: 85-100%humidity: 82% | wind: 2 km/h
NOVEMBER 2
25°C / 29°C
light rainhumidity: 84% | wind: 2 km/h
NOVEMBER 3
29°C / 29°C
broken clouds: 51-84%humidity: 75% | wind: 2 km/h


Sea Temperature in the Caribbean Sea in Moa: General Trends and Swimming Opportunities
Cuba's coastal areas typically experience a tropical climate with hot, humid summers and mild winters. These regions are also characterized by a wet season from May to October, and a drier season from November to April.
Moa is located in Central America in the Northern Hemisphere at a latitude of 21 degrees, along the shores of the Caribbean Sea. Moa lies within in Cuba.
The average annual daytime air temperature in Moa is 86°F (30°C), with the average nighttime temperature being 72°F (22°C). The highest average daily temperature occurs in August, reaching 91°F (33°C), while the lowest is in January at 83°F (28°C). As for nighttime temperatures, the minimum average temperature of 68°F (20°C) is recorded in February, and the maximum is in August, reaching 75°F (24°C).
According to historical data, Moa experiences 95 rainy days per year, which accounts for 26 percent of all days in the year. On average, there are 8 rainy days each month. The wettest month is October, with 12 rainy days and 13.5 inches (342 mm) of precipitation, while the driest month is February, which typically has 5 rainy days and only 4.0 inches (101 mm) of precipitation.
The average annual water temperature in Caribbean Sea in Moa is 82°F (28°C). In January, the water reaches its lowest point of the year at 75°F (24°C), while in August, it peaks at 88°F (31°C). The water temperature in the Caribbean Sea in Moa is comfortable for beach vacations and swimming year-round.
Geographical Location of Moa
Nearby Cities
Frequently Asked Questions About Moa and its Water Temperatures
What is the current sea temperature in Moa?
The water temperature today in the Caribbean Sea in Moa is 84°F (29°C).
In which months is the water temperature in Moa comfortable for swimming?
The water temperature in Moa is comfortable for beach vacations and swimming throughout the year.
What is the water temperature in Moa during the winter?
The water temperature in the Caribbean Sea in Moa during the winter ranges from 75°F to 84°F (24°C to 29°C).
What is the water temperature in Moa during the spring?
The water temperature in the Caribbean Sea in Moa during the spring ranges from 77°F to 84°F (25°C to 29°C).
What is the water temperature in Moa during the summer?
The water temperature in the Caribbean Sea in Moa during the summer ranges from 79°F to 88°F (26°C to 31°C).
What is the water temperature in Moa during the fall?
The water temperature in the Caribbean Sea in Moa during the fall ranges from 79°F to 88°F (26°C to 31°C).
Is it possible to swim in the sea in Moa year-round?
Yes, it is possible to swim in the Caribbean Sea in Moa year-round because the water temperature never drops below 75°F (24°C)
What sea temperatures can I expect in Moa in the next month?
In November, the water temperature in the Caribbean Sea in Moa will range between 79°F (26°C) and 86°F (30°C)