
Search for cities, countries, lakes and rivers
Yandang
Water Temperature in the East China Sea in Yandang, China: Current, Historical Data and Forecast
On this page, you will find comprehensive information about the sea temperature in Yandang in China, including current readings, historical data and trends, monthly averages, as well as weather forecasts and upcoming temperature predictions. We find every spot where you can swim and tell you what the water temperature is there today and throughout the year.
Current Water Temperature in Yandang
25.3°C
TODAY
25.2°C
YESTERDAY
27.6°C
A WEEK AGO
Analysis, Historical Data, and Forecast of Water Temperature
Today sea water temperature in the East China Sea in Yandang is 25.3°C. This is a very comfortable temperature for swimming, and many people can enjoy prolonged stays in the water without feeling cold. The water is pleasantly warm, making it ideal for relaxation and water sports. This temperature range is particularly popular among tourists, as it combines comfort and safety for health.
It is important to note that these swimming tips and recommendations apply only in good weather. When the air temperature is below 68°F (20°C), and sometimes even below 77°F (25°C), swimming can be unpleasant even with relatively high water temperatures.
Water Temperature Chart for East China Sea in Yandang Over the Last 30 Days
The water temperature in Yandang today is lower than both a week ago and a month ago. Today's sea temperature is generally in line with historical values for this day.
According to our forecast, the sea temperature in Yandang will drop slightly in the coming days and reach 23.0°C.
Actual nearshore water temperatures may fluctuate by several degrees from the reported values, especially following heavy rainfall or extended periods of strong winds. Certain wind patterns can cause colder, deeper waters to rise and replace the sun-warmed surface water, leading to noticeable variations.
Our forecast is based on a proprietary mathematical model that considers real-time water temperature changes, historical trends, key weather patterns, wind strength and direction, and air temperature specific to each region. Additionally, we incorporate data from other resorts across China to enhance accuracy.
Water temperature data for Yandang and nearby towns and resorts is gathered from various sources, including buoys and satellite sea and ocean surface maps provided by the NOAA agency. We also incorporate data from local authorities in each specific location worldwide to ensure more accurate temperature readings.
Table of Daily Sea Temperature Data
| Date | Current | Average | Forecast |
|---|---|---|---|
| Oct 18 | 27.6°C | 25.8°C | |
| Oct 19 | 28.4°C | 25.8°C | |
| Oct 20 | 27.5°C | 25.5°C | |
| Oct 21 | 27.9°C | 26.0°C | |
| Oct 22 | 28.0°C | 25.8°C | |
| Oct 23 | 27.0°C | 25.8°C | |
| Oct 24 | 25.2°C | 24.5°C | |
| Oct 25 | 25.4°C | 24.0°C | |
| Oct 26 | 23.5°C | 25.0°C | |
| Oct 27 | 23.0°C | 24.7°C | |
| Oct 28 | 23.3°C | 24.5°C | |
| Oct 29 | 23.3°C | 24.3°C | |
| Oct 30 | 22.3°C | 24.0°C | |
| Oct 31 | 22.5°C | 23.8°C | |
| Nov 1 | 21.0°C | 23.3°C | |
| Nov 2 | 21.5°C | 23.0°C |
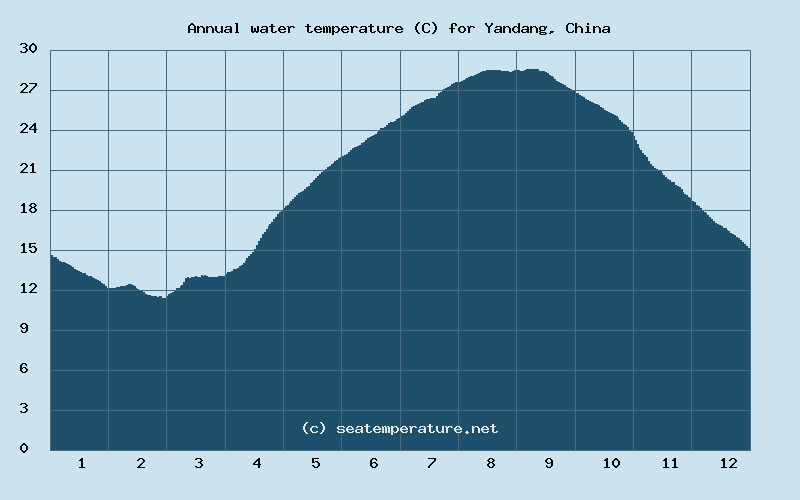
Sea Temperature in Yandang Throughout the Year
Throughout the year, the sea temperature in Yandang exceeds 77°F (25°C) for 107 days, exceeds 72°F (22°C) for 156 days, and exceeds 64°F (18°C) for 218 days.
Below is the annual chart of sea temperature changes in the East China Sea in Yandang.
January
| Minimum | Average | Maximum |
|---|---|---|
| 10°C | 13°C | 16°C |
February
| Minimum | Average | Maximum |
|---|---|---|
| 9°C | 11.5°C | 14°C |
March
| Minimum | Average | Maximum |
|---|---|---|
| 9°C | 13.5°C | 18°C |
April
| Minimum | Average | Maximum |
|---|---|---|
| 11°C | 16.5°C | 22°C |
May
| Minimum | Average | Maximum |
|---|---|---|
| 16°C | 21°C | 26°C |
June
| Minimum | Average | Maximum |
|---|---|---|
| 20°C | 24°C | 28°C |
July
| Minimum | Average | Maximum |
|---|---|---|
| 23°C | 26.5°C | 30°C |
August
| Minimum | Average | Maximum |
|---|---|---|
| 25°C | 28°C | 31°C |
September
| Minimum | Average | Maximum |
|---|---|---|
| 24°C | 27.5°C | 31°C |
October
| Minimum | Average | Maximum |
|---|---|---|
| 20°C | 24.5°C | 29°C |
November
| Minimum | Average | Maximum |
|---|---|---|
| 17°C | 20°C | 23°C |
December
| Minimum | Average | Maximum |
|---|---|---|
| 11°C | 16°C | 21°C |
Monthly Water Temperature Histogram for East China Sea in Yandang
You can explore detailed data on how the water temperature in Yandang varies each month:
Yandang Weather
OCTOBER 26
17°C / 21°C
few clouds: 11-25%humidity: 71% | wind: 9 km/h
OCTOBER 27
16°C / 18°C
light rainhumidity: 78% | wind: 8 km/h
OCTOBER 28
17°C / 22°C
broken clouds: 51-84%humidity: 66% | wind: 5 km/h
OCTOBER 29
19°C / 20°C
overcast clouds: 85-100%humidity: 78% | wind: 5 km/h


Sea Temperature in the East China Sea in Yandang: General Trends and Swimming Opportunities
The coastal region of Zhejiang, China experiences a subtropical monsoon climate with four distinct seasons. It is characterized by a humid and rainy environment, showcasing hot summers and cool winters.
Yandang is located in Asia in the Northern Hemisphere at a latitude of 28 degrees, along the shores of the East China Sea. Yandang lies within the Zhejiang in China.
The average annual daytime air temperature in Yandang is 20°C (68°F), with the average nighttime temperature being 14°C (57°F). The highest average daily temperature occurs in July, reaching 32°C (89°F), while the lowest is in January at 8°C (47°F). As for nighttime temperatures, the minimum average temperature of 3°C (38°F) is recorded in January, and the maximum is in August, reaching 25°C (76°F).
According to historical data, Yandang experiences 125 rainy days per year, which accounts for 34 percent of all days in the year. On average, there are 10 rainy days each month. The wettest month is June, with 14 rainy days and 164 mm (6.5 inches) of precipitation, while the driest month is December, which typically has 7 rainy days and only 52 mm (2.0 inches) of precipitation.
The average annual water temperature in East China Sea in Yandang is 20°C (68°F). In February, the water reaches its lowest point of the year at 9°C (48°F), while in August, it peaks at 31°C (88°F). The months suitable for comfortable beach vacations and swimming in the East China Sea are July, August, and September. During this period, the water temperature stays above 20°C (68°F) and can reach up to 31°C (88°F) on some days.
Geographical Location of Yandang
Frequently Asked Questions About Yandang and its Water Temperatures
What is the current sea temperature in Yandang?
The water temperature today in the East China Sea in Yandang is 78°F (25.3°C).
In which months is the water temperature in Yandang comfortable for swimming?
The water temperature in the East China Sea in Yandang is comfortable for swimming and beach vacations in July, August, and September.
What is the water temperature in Yandang during the winter?
The water temperature in the East China Sea in Yandang during the winter ranges from 9°C to 21°C (48°F to 70°F).
What is the water temperature in Yandang during the spring?
The water temperature in the East China Sea in Yandang during the spring ranges from 9°C to 26°C (48°F to 79°F).
What is the water temperature in Yandang during the summer?
The water temperature in the East China Sea in Yandang during the summer ranges from 20°C to 31°C (68°F to 88°F).
What is the water temperature in Yandang during the fall?
The water temperature in the East China Sea in Yandang during the fall ranges from 17°C to 31°C (63°F to 88°F).
Is it possible to swim in the sea in Yandang year-round?
No, it is not possible to swim in the East China Sea in Yandang year-round, the months suitable for comfortable swimming are July, August, and September.
What sea temperatures can I expect in Yandang in the next month?
In November, the water temperature in the East China Sea in Yandang will range between 63°F (17°C) and 73°F (23°C)