
Search for cities, countries, lakes and rivers
Valdivia

Water Temperature in the Pacific Ocean in Valdivia, Chile: Current, Historical Data and Forecast
On this page, you will find comprehensive information about the sea temperature in Valdivia in Chile, including current readings, historical data and trends, monthly averages, as well as weather forecasts and upcoming temperature predictions. We find every spot where you can swim and tell you what the water temperature is there today and throughout the year.
Current Water Temperature in Valdivia
11.2°C
TODAY
10.6°C
YESTERDAY
10.6°C
A WEEK AGO
Analysis, Historical Data, and Forecast of Water Temperature
Today sea water temperature in the Pacific Ocean in Valdivia is 11.2°C. The water is slightly warmer, but still cool for most people. Swimming in such conditions is possible, but for most people, the time spent in the water should be limited to avoid hypothermia. Even experienced swimmers may feel discomfort if they stay in the water for too long. To improve comfort and safety, a wetsuit can be used.
It is important to note that these swimming tips and recommendations apply only in good weather. When the air temperature is below 68°F (20°C), and sometimes even below 77°F (25°C), swimming can be unpleasant even with relatively high water temperatures.
Water Temperature Chart for Pacific Ocean in Valdivia Over the Last 30 Days
The water temperature in Valdivia today is lower than both a week ago and a month ago. Today's sea temperature is generally in line with historical values for this day.
According to our forecast, the sea temperature in Valdivia will remain nearly unchanged in the coming days, its value will be 11.1°C.
Actual nearshore water temperatures may fluctuate by several degrees from the reported values, especially following heavy rainfall or extended periods of strong winds. Certain wind patterns can cause colder, deeper waters to rise and replace the sun-warmed surface water, leading to noticeable variations.
Our forecast is based on a proprietary mathematical model that considers real-time water temperature changes, historical trends, key weather patterns, wind strength and direction, and air temperature specific to each region. Additionally, we incorporate data from other resorts across Chile to enhance accuracy.
Water temperature data for Valdivia and nearby towns and resorts is gathered from various sources, including buoys and satellite sea and ocean surface maps provided by the NOAA agency. We also incorporate data from local authorities in each specific location worldwide to ensure more accurate temperature readings.
Table of Daily Sea Temperature Data
| Date | Current | Average | Forecast |
|---|---|---|---|
| Jul 10 | 10.6°C | 11.8°C | |
| Jul 11 | 10.7°C | 11.0°C | |
| Jul 12 | 10.8°C | 11.3°C | |
| Jul 13 | 10.8°C | 11.5°C | |
| Jul 14 | 10.9°C | 11.3°C | |
| Jul 15 | 10.5°C | 10.5°C | |
| Jul 16 | 10.6°C | 10.3°C | |
| Jul 17 | 11.2°C | 11.5°C | |
| Jul 18 | 11.3°C | 11.2°C | |
| Jul 19 | 10.8°C | 11.1°C | |
| Jul 20 | 11.0°C | 11.1°C | |
| Jul 21 | 10.5°C | 11.0°C | |
| Jul 22 | 11.5°C | 11.1°C | |
| Jul 23 | 11.8°C | 11.2°C | |
| Jul 24 | 10.8°C | 11.1°C | |
| Jul 25 | 11.5°C | 11.1°C |
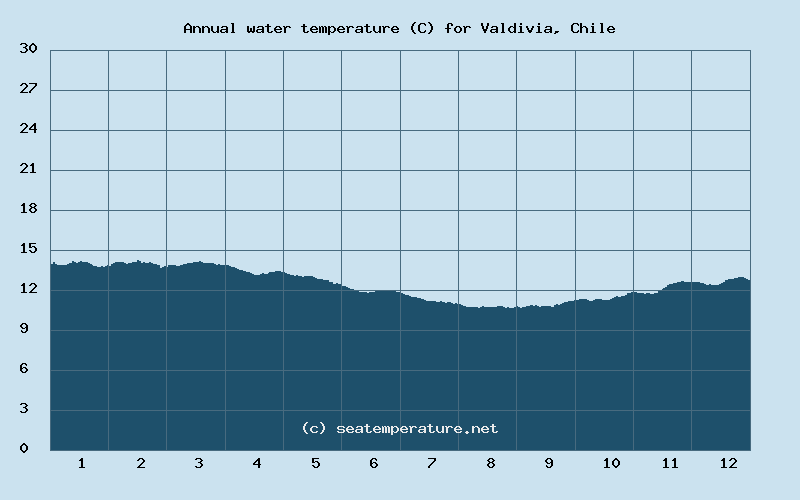
Sea Temperature in Valdivia Throughout the Year
Throughout the year, the sea temperature in Valdivia never exceeds 64°F (18°C).
Below is the annual chart of sea temperature changes in the Pacific Ocean in Valdivia.
January
| Minimum | Average | Maximum |
|---|---|---|
| 11°C | 13.5°C | 16°C |
February
| Minimum | Average | Maximum |
|---|---|---|
| 11°C | 14°C | 17°C |
March
| Minimum | Average | Maximum |
|---|---|---|
| 11°C | 13.5°C | 16°C |
April
| Minimum | Average | Maximum |
|---|---|---|
| 10°C | 12.5°C | 15°C |
May
| Minimum | Average | Maximum |
|---|---|---|
| 9°C | 12°C | 15°C |
June
| Minimum | Average | Maximum |
|---|---|---|
| 9°C | 11.5°C | 14°C |
July
| Minimum | Average | Maximum |
|---|---|---|
| 8°C | 10.5°C | 13°C |
August
| Minimum | Average | Maximum |
|---|---|---|
| 8°C | 10°C | 12°C |
September
| Minimum | Average | Maximum |
|---|---|---|
| 9°C | 11°C | 13°C |
October
| Minimum | Average | Maximum |
|---|---|---|
| 9°C | 11.5°C | 14°C |
November
| Minimum | Average | Maximum |
|---|---|---|
| 10°C | 12.5°C | 15°C |
December
| Minimum | Average | Maximum |
|---|---|---|
| 10°C | 13°C | 16°C |
Monthly Water Temperature Histogram for Pacific Ocean in Valdivia
You can explore detailed data on how the water temperature in Valdivia varies each month:
What Beaches Are There In and Around Valdivia?
Collico Beach
Collico Beach is a 5-stars sandy beach, located in a 3 km (2 miles) radius of Valdivia. There are lifeguards on the beach. There is parking. There are restrooms. There are cafés. The calm waters make this beach ideal for swimming, providing a safe and enjoyable experience for all visitors.
Valdivia Weather
JULY 18
10°C / 13°C
light rainhumidity: 99% | wind: 0 km/h
JULY 19
10°C / 12°C
light rainhumidity: 95% | wind: 1 km/h
JULY 20
2°C / 9°C
light rainhumidity: 90% | wind: 1 km/h
JULY 21
7°C / 7°C
light rainhumidity: 82% | wind: 1 km/h


Sea Temperature in the Pacific Ocean in Valdivia: General Trends and Swimming Opportunities
The coastal area of Chile experiences a Mediterranean climate with warm summers and mild, wet winters. The Humboldt Current in the Pacific Ocean brings cooler temperatures, resulting in significant temperature variation throughout the year.
Valdivia is located in South America in the Southern Hemisphere at a latitude of -40 degrees, along the shores of the Pacific Ocean. Valdivia lies within in Chile.
The average annual daytime air temperature in Valdivia is 14°C (57°F), with the average nighttime temperature being 5°C (41°F). The highest average daily temperature occurs in January, reaching 20°C (69°F), while the lowest is in July at 9°C (49°F). As for nighttime temperatures, the minimum average temperature of 2°C (36°F) is recorded in July, and the maximum is in January, reaching 9°C (48°F).
According to historical data, Valdivia experiences 156 rainy days per year, which accounts for 43 percent of all days in the year. On average, there are 13 rainy days each month. The wettest month is June, with 19 rainy days and 334 mm (13.2 inches) of precipitation, while the driest month is February, which typically has 8 rainy days and only 56 mm (2.2 inches) of precipitation.
The average annual water temperature in Pacific Ocean in Valdivia is 12°C (54°F). In July, the water reaches its lowest point of the year at 8°C (46°F), while in February, it peaks at 17°C (63°F). In Valdivia, the water temperature in the Pacific Ocean never consistently reaches a comfortable level for swimming in any month.
Geographical Location of Valdivia
Frequently Asked Questions About Valdivia and its Water Temperatures
What is the current sea temperature in Valdivia?
The water temperature today in the Pacific Ocean in Valdivia is 52°F (11.2°C).
In which months is the water temperature in Valdivia comfortable for swimming?
It cannot be guaranteed that the water temperature in Valdivia will be comfortable for swimming in any month of the year.
What is the water temperature in Valdivia during the winter?
The water temperature in the Pacific Ocean in Valdivia during the winter ranges from 10°C to 17°C (50°F to 63°F).
What is the water temperature in Valdivia during the spring?
The water temperature in the Pacific Ocean in Valdivia during the spring ranges from 9°C to 16°C (48°F to 61°F).
What is the water temperature in Valdivia during the summer?
The water temperature in the Pacific Ocean in Valdivia during the summer ranges from 8°C to 14°C (46°F to 57°F).
What is the water temperature in Valdivia during the fall?
The water temperature in the Pacific Ocean in Valdivia during the fall ranges from 9°C to 15°C (48°F to 59°F).
Is it possible to swim in the sea in Valdivia at any time of the year?
In Valdivia, the Pacific Ocean is quite cold, and swimming is almost impossible as the water temperature never reaches 21°C (70°F).
What sea temperatures can I expect in Valdivia in the next month?
In August, the water temperature in the Pacific Ocean in Valdivia will range between 46°F (8°C) and 54°F (12°C)